环境
CentOS 8
什么是 Prometheus
Prometheus 是一套开源的系统监控报警框架。它启发于 Google 的 borgmon 监控系统,由工作在 SoundCloud 的 google 前员工在 2012 年创建,作为社区开源项目进行开发,并于 2015 年正式发布。2016 年,Prometheus 正式加入 Cloud Native Computing Foundation,成为受欢迎度仅次于 Kubernetes 的项目。
作为新一代的监控框架,Prometheus 具有以下特点:
强大的多维度数据模型:
时间序列数据通过 metric 名和键值对来区分。
所有的 metrics 都可以设置任意的多维标签。
数据模型更随意,不需要刻意设置为以点分隔的字符串。
可以对数据模型进行聚合,切割和切片操作。
支持双精度浮点类型,标签可以设为全 unicode。
灵活而强大的查询语句(PromQL):在同一个查询语句,可以对多个 metrics 进行乘法、加法、连接、取分数位等操作。
易于管理: Prometheus server 是一个单独的二进制文件,可直接在本地工作,不依赖于分布式存储。
高效:平均每个采样点仅占 3.5 bytes,且一个 Prometheus server 可以处理数百万的 metrics。
使用 pull 模式采集时间序列数据,这样不仅有利于本机测试而且可以避免有问题的服务器推送坏的 metrics。
可以采用 push gateway 的方式把时间序列数据推送至 Prometheus server 端。
可以通过服务发现或者静态配置去获取监控的 targets。
有多种可视化图形界面。
易于伸缩。
需要指出的是,由于数据采集可能会有丢失,所以 Prometheus 不适用对采集数据要 100% 准确的情形。但如果用于记录时间序列数据,Prometheus 具有很大的查询优势,此外,Prometheus 适用于微服务的体系架构。
Prometheus 组成及架构
Prometheus 生态圈中包含了多个组件,其中许多组件是可选的:
- Prometheus Server: 用于收集和存储时间序列数据。
- Client Library: 客户端库,为需要监控的服务生成相应的 metrics 并暴露给 Prometheus server。当 Prometheus server 来 pull 时,直接返回实时状态的 metrics。
- Push Gateway: 主要用于短期的 jobs。由于这类 jobs 存在时间较短,可能在 Prometheus 来 pull 之前就消失了。为此,这次 jobs 可以直接向 Prometheus server 端推送它们的 metrics。这种方式主要用于服务层面的 metrics,对于机器层面的 metrices,需要使用 node exporter。
- Exporters: 用于暴露已有的第三方服务的 metrics 给 Prometheus。
- Alertmanager: 从 Prometheus server 端接收到 alerts 后,会进行去除重复数据,分组,并路由到对收的接受方式,发出报警。常见的接收方式有:电子邮件,pagerduty,OpsGenie, webhook 等。
- 一些其他的工具。
图 1 为 Prometheus 官方文档中的架构图:
图 1. Prometheus 架构图
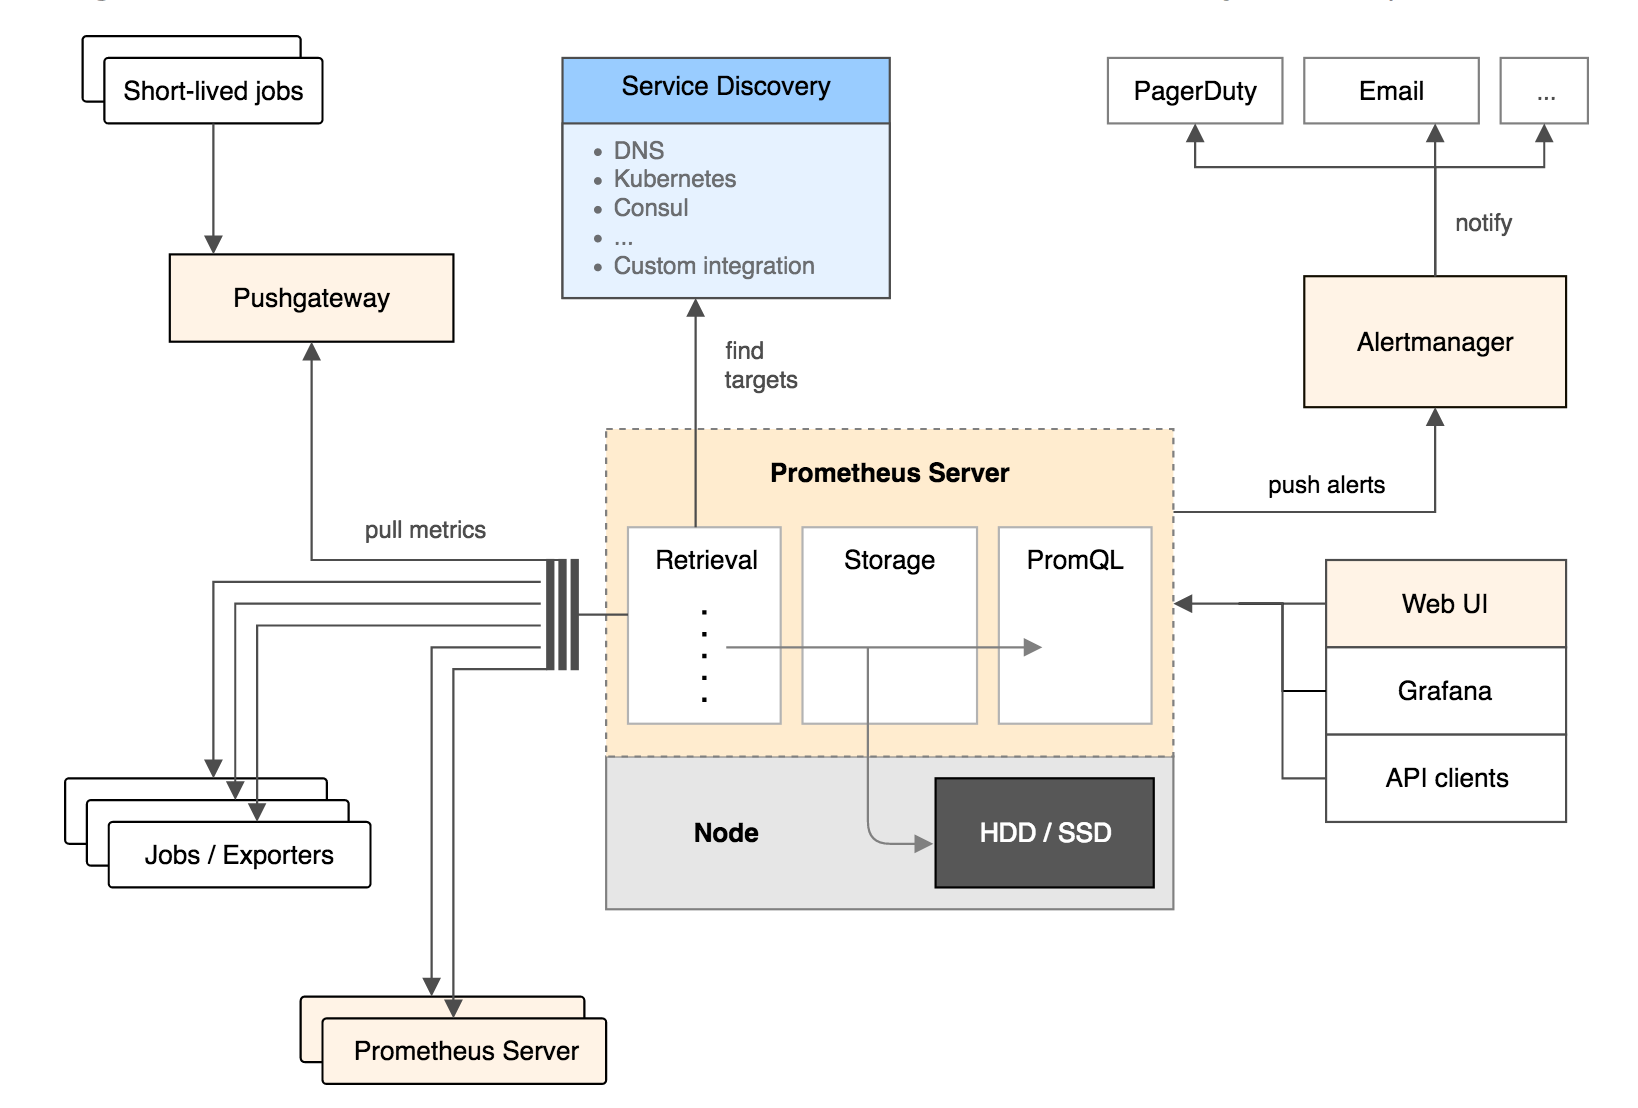
从上图可以看出,Prometheus 的主要模块包括:Prometheus server, exporters, Pushgateway, PromQL, Alertmanager 以及图形界面。
其大概的工作流程是:
- Prometheus server 定期从配置好的 jobs 或者 exporters 中拉 metrics,或者接收来自 Pushgateway 发过来的 metrics,或者从其他的 Prometheus server 中拉 metrics。
- Prometheus server 在本地存储收集到的 metrics,并运行已定义好的 alert.rules,记录新的时间序列或者向 Alertmanager 推送警报。
- Alertmanager 根据配置文件,对接收到的警报进行处理,发出告警。
- 在图形界面中,可视化采集数据。
什么是 Grafana
Grafana可以通过可视化的方式向你呈现数据。在Grafana中,你可以通过将Prometheus添加为数据源,来将Grafana作为前端的数据展示。
node_exporter 安装
获取 node_exporter
1 | wget https://github.com/prometheus/node_exporter/releases/download/v0.18.1/node_exporter-0.18.1.linux-amd64.tar.gz |
默认监听9100端口,可通过
--web.listen-address=":9100"修改
创建 Systemd
/etc/systemd/system/node_exporter.service
1 | [Unit] |
1 | systemctl enable node_exporter |
Prometheus 安装
获取 Prometheus
1 | wget https://github.com/prometheus/prometheus/releases/download/v2.17.1/prometheus-2.17.1.linux-amd64.tar.gz |
Prometheus 配置追加 node_exporter
/usr/local/etc/prometheus/prometheus.yml
1 | scrape_configs: |
创建 Systemd
/etc/systemd/system/prometheus.service
1 | [Unit] |
1 | systemctl enable prometheus |
Grafana 安装
1 | wget https://dl.grafana.com/oss/release/grafana-6.7.2-1.x86_64.rpm |
添加 Prometheus 作为数据源

在 https://grafana.com/grafana/dashboards 有相当多别人分享的 Dashboard,可以方便的导入使用
监控效果
